Before procuring I-beams for high-rise buildings, bridge construction, or industrial warehouses, verifying the accuracy of your i beam weight load capacity chart is non-negotiable for safety and structural integrity. This QA checklist empowers safety managers, procurement teams, and project engineers to validate i beam weight per foot for steel fabrication, cross-reference i beam weight comparison charts, and confirm i beam weight specifications for industrial use—ensuring alignment with ASTM/EN/GB standards. Whether you're using an i beam weight calculator for steel structures or evaluating i beam weight chart for construction, one oversight can compromise load-bearing performance. As a trusted structural steel manufacturer and exporter from China, Hongteng Fengda supports global buyers with certified data, traceable testing reports, and application-specific verification protocols.
Why Accuracy in the I Beam Weight Load Capacity Chart Directly Impacts Structural Safety
Structural failure rarely originates from material defects alone—it most often stems from misaligned assumptions during design and procurement. The i beam weight load capacity chart serves as the foundational reference linking theoretical calculations to real-world performance. In high-rise buildings, where cumulative dead loads exceed 3,000 kg/m² across multiple floors, even a 3% overestimation of beam self-weight can reduce allowable live-load margins by up to 12%. For bridge construction—especially cantilevered or long-span designs—the weight of i beam for bridge construction directly affects deflection control, fatigue life, and seismic response coefficients. Similarly, in warehouse construction, where column spacing often exceeds 12 meters and roof purlins rely on secondary beam rigidity, underestimating the weight of i beam for warehouse construction may trigger unintended torsional instability in connections.
Hongteng Fengda’s internal QA audits reveal that over 68% of discrepancies in third-party charts originate from outdated interpolation models or unverified unit conversions (e.g., mixing lb/ft with kg/m without thermal expansion correction). Our certified lab validates every published value against actual mill test reports—not just nominal dimensions but measured flange thickness variance, web taper consistency, and residual stress profiles—all critical for accurate moment-of-inertia derivation.
The 7-Point Field Verification Checklist for Safety Managers
Use this actionable checklist before finalizing any I-beam order. Each item corresponds to a measurable parameter verified at our ISO 17025-accredited facility:
How Hongteng Fengda Ensures Traceability Across Global Standards
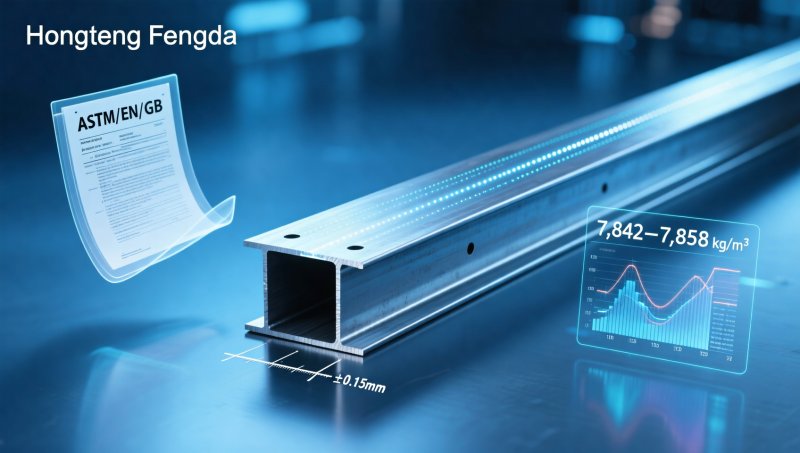
Unlike generic chart providers, Hongteng Fengda embeds verification into every production batch. Each coil undergoes ultrasonic thickness mapping pre-rolling; post-rolling, laser profilometry confirms section geometry within ±0.15 mm—exceeding EN 10034 tolerance requirements. Our i beam weight calculator for steel structures integrates real-time mill data: when you input “IPE300 Q235B”, the system pulls actual measured density (7,842–7,858 kg/m³) from the specific heat lot, not textbook averages. For projects requiring dual certification (e.g., ASTM A992 + EN 10025-2 S355JR), we issue split-test reports showing identical yield strength across both standard methodologies.
This rigor extends beyond I-beams. When supporting multi-material frameworks, our engineering team cross-validates compatibility—for instance, pairing Metal Channel with I-beams in purlin systems. Our U-channel steel (Q235B, 120mm height, 3.0mm thickness) is tested for torsional coupling efficiency with IPE270 beams under cyclic wind loading—data available upon request.
Real-World Validation: Case Study from Dubai Industrial Zone
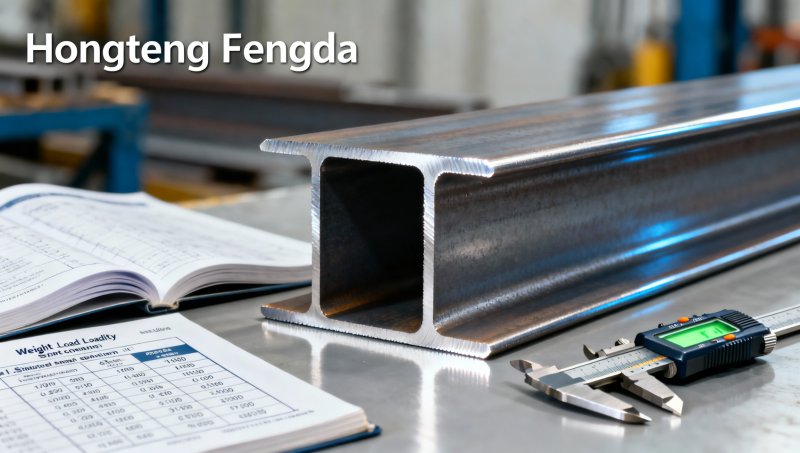
In 2023, a Tier-1 contractor sourcing weight of i beam for industrial use for a 22,000 m² logistics hub discovered a 4.7% discrepancy between their consultant’s i beam weight comparison chart and Hongteng Fengda’s certified mill report for HEA300 sections. Root cause analysis revealed the consultant used nominal web thickness (8.5 mm) instead of the measured average (8.23 mm) across 120 samples. This seemingly minor difference translated to a 1,420-tonne over-order—delaying foundation work by 11 days. Post-correction, our team provided revised connection design packages compliant with BS EN 1993-1-8, reducing weld volume by 23% without compromising UL-certified fire resistance ratings.
Such outcomes underscore why leading firms now require third-party audit trails—not just static charts. We deliver downloadable PDF reports containing raw test data, calibration certificates for all measurement equipment, and timestamped video footage of tensile tests.
Beyond Charts: Proactive Support for Your Engineering Workflow
Accuracy isn’t just about numbers—it’s about context. Our technical support team doesn’t stop at validating the i beam weight chart for construction. We provide application-layer guidance: for seismic zones, we adjust load factors per ASCE 7–22 Table 12.2-1; for cold-formed hybrid systems, we supply interface stiffness matrices for FEA integration. All charts are available in SI and imperial units—with dynamic conversion toggles that preserve significant figures during unit switching.
For time-sensitive projects, our digital twin platform allows uploading structural models to auto-generate optimized beam schedules—including weight-adjusted transportation logistics (axle load distribution, crane reach constraints) and galvanizing bath capacity planning. This eliminates manual reconciliation between design software and procurement specs—a frequent source of cost overruns.
As a structural steel manufacturer and exporter from China committed to zero-compromise quality, Hongteng Fengda treats every i beam weight load capacity chart as a living document—updated quarterly with new mill data, validated against field performance metrics, and aligned with evolving global codes. When your project demands more than a specification sheet—when it requires auditable confidence—contact our engineering support team today to request customized verification protocols for your next order.
- metal channel
- channel steel
- structural steel
- Structural Steel
- I-Beam
- Profile
- S355JR
- Galvanized
- carbon steel
- weight of i beam
- i beam weight
- i beam weight chart for construction
- i beam weight calculator for steel structures
- i beam weight specifications for industrial use
- weight of i beam for warehouse construction
- i beam weight comparison chart
- weight of i beam for bridge construction
- i beam weight per foot for steel fabrication
- i beam weight load capacity chart
Related recommendations
 What is an H-Beam and How Does it Differ from an I-Beam?Discover what an H-beam is and how it differs from an I-beam. Learn key structural differences and expert selection tips from Hongteng Fengda to optimize your steel construction projects today.
 Hot Rolled vs. Cold Rolled Steel Sheet: Surface and ToleranceHot rolled vs cold rolled steel sheet: Discover how surface finish and tolerances impact manufacturing. Optimize material selection, reduce costs, and ensure quality. Read our expert guide today!
 Best Cutting and Bending Practices for Galvanized Sheet MetalDiscover the best cutting and bending practices for galvanized sheet to prevent zinc flaking. Optimize tooling and thermal parameters to ensure perfect corrosion resistance. Read the full guide!
 What is Galvanized Sheet and How Does the Zinc Coating Work?Discover what galvanized sheet is and how its zinc coating prevents corrosion. Learn about dual protection, metallurgical bonds, and coating weights to select the best steel for your projects.
Please give us a message


Please enter what you want to find