A steel beam weight chart helps technical evaluators compare section sizes and unit weights before selecting materials for a project. The numbers look straightforward, but a designation drawn from one standard may not describe the same section as a similar-looking designation from another. Reading the section family, dimensions and mass units together is essential for an accurate specification review.
Whether you are checking a bill of materials, comparing an overseas offer or estimating a shipment, the chart is a useful starting point—not a substitute for structural design or the applicable product standard.
What a beam weight chart actually tells you
Most charts list the nominal mass of a standard beam per unit of length, alongside its section designation and principal dimensions. Depending on the source, they may also provide cross-sectional area, second moment of area, section modulus and other properties used in engineering calculations.
A typical entry can contain the following information:
- Section designation: The name used to identify a particular rolled shape and size.
- Depth, d or h: The overall distance between the outside faces of the flanges.
- Flange width, b or bf: The width of a flange measured across the section.
- Web thickness, tw: The thickness of the central vertical portion.
- Flange thickness, tf: The thickness of a flange at the location defined by the applicable standard.
- Unit mass: Commonly expressed in kilograms per meter or pounds per foot.
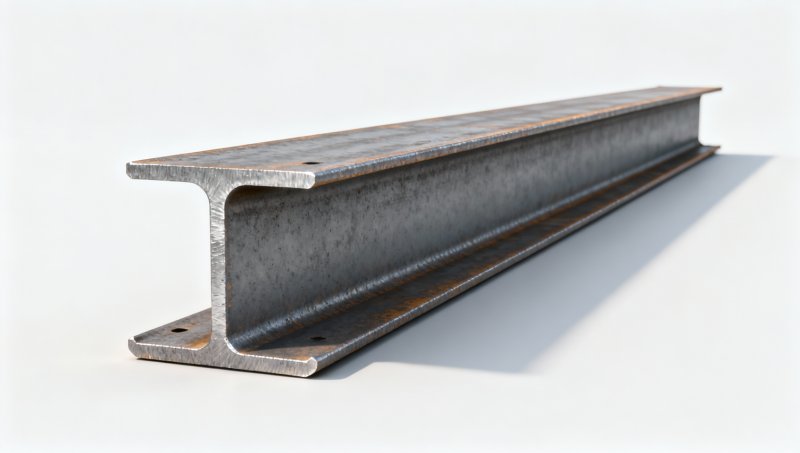
Check the chart legend before comparing values. Some section families have tapered flanges, root radii or dimensions measured at specified positions. A simple sketch may label the features, but the relevant section standard defines how the dimensions are reported.
How to read common section designations
Beam names are not universal codes. The same letter or number can carry a different meaning depending on the section family and the publication. Always identify the standard and shape series before interpreting the designation.
For a W12×26, the “12” should not be treated as an exact measured depth. Likewise, the final number in IPE 200 is not its mass per meter. A quick interpretation based only on the visible numbers can therefore lead to an incorrect comparison.
GB section tables also use their own series and designations for hot-rolled shapes. When reviewing a Chinese supplier’s offer, request the exact section standard and designation rather than assuming that a nominal depth alone identifies the beam. ASTM, EN, JIS and GB references may cover different aspects of a product: distinguish the dimensional standard from the steel grade and delivery requirements.
Unit weight, mass and the numbers behind the chart
In purchasing documents, “weight per meter” usually means mass per meter, expressed as kg/m. Strictly speaking, weight is a force, but the commercial wording is common. Make sure the quantity being compared is clear, especially when a structural calculation uses force units such as kN/m.
For a uniform steel section, theoretical mass per unit length can be estimated from its cross-sectional area:
Mass per meter (kg/m) = area (mm²) × 0.00785
This relationship assumes a conventional steel density of 7,850 kg/m³. For example, a section with an area of 3,000 mm² has an estimated mass of 23.55 kg/m. Published values may differ slightly because of rounding, the area used by the table and the standard’s treatment of section geometry.
For an initial estimate, the area of a parallel-flange I-section can be approximated as:
Area ≈ 2 × b × tf + (h − 2 × tf) × tw
All dimensions in this expression are in millimeters. It ignores root fillets and other geometric details, so it should not replace the published area or mass for a specific rolled section. The difference matters when a small per-meter error is multiplied across a large order.
Converting kg/m and lb/ft
- kg/m to lb/ft: multiply by approximately 0.672.
- lb/ft to kg/m: multiply by approximately 1.488.
For instance, 26 lb/ft is approximately 38.7 kg/m. Keep enough decimal places during calculations and round the final quantity to the precision needed for the estimate. A conversion aligns the units; it does not make two differently standardized sections interchangeable.
Worked example: from chart value to order mass
Suppose a material schedule calls for 40 beams, each 6 m long, and the verified section table lists a nominal mass of 23.6 kg/m. The theoretical mass of the straight beam stock is:
40 pieces × 6 m × 23.6 kg/m = 5,664 kg
That is approximately 5.66 metric tonnes before considering fabrication or ordering allowances. The figure is useful for an early material estimate, but it is not automatically the invoice mass or final shipping mass.
For procurement, separate the quantities that are easy to mix up:
- Finished length: The length required on the drawing after cutting.
- Purchased length: The stock length ordered, which may include cutting allowance and offcuts.
- Fabricated mass: The beam mass after relevant cuts and openings, plus any attached plates or other components.
- Shipping mass: The mass used for transport planning, which may also include packaging or securing materials.
Holes, copes, end cuts and welded attachments can move the fabricated total away from a simple length-times-unit-mass calculation. For a preliminary estimate, state what has been included rather than presenting a nominal chart figure as an exact scale weight.
Comparing beams across ASTM, EN, JIS and GB references
A familiar nominal size is not sufficient evidence of equivalence. Two beams with similar depths can have different flange widths, thicknesses, radii and section properties. Even when their mass per meter is close, their behavior under bending, shear or lateral-torsional buckling may differ.
For a technical comparison, assemble the information in layers:
- Match the shape and geometry. Record the section family, depth, flange width, web and flange thicknesses, and applicable dimensional tolerances.
- Compare published section properties. Review area, mass, second moments of area and section moduli about the relevant axes. Include torsional properties where the design requires them.
- Identify the material grade. Check specified strength, chemical composition, toughness and weldability requirements against the project documents.
- Confirm the product standard and condition. The section standard, material standard, delivery condition and inspection requirements should all be traceable in the proposed supply.
- Obtain design approval. Treat any alternate section as a proposed substitution until the responsible engineer has checked it under the governing design code.
Grade names deserve particular care. A36, SS400, Q235 and S235-family designations belong to different specification systems; they should not be treated as automatically equivalent merely because they appear in a supplier’s material list. The appropriate comparison depends on the exact grade, product thickness, standard edition and project requirements.
Mass alone is especially tempting when bids arrive in different formats. It helps normalize a cost or freight estimate, but it cannot establish whether a proposed section satisfies deflection limits or connection details. A slightly heavier beam is not necessarily stronger in the axis that governs the design.
What to verify before accepting a supplier’s chart
A useful chart should identify its source, section series and units. If those are missing, ask for the applicable standard and the published dimensions or properties for each offered size. For a project with controlled documentation, request the relevant inspection documents and material certificates required by the purchase specification, and check that they correspond to the delivered product.
Hongteng Fengda supplies Structural I Beam for industrial structures, with listed standard lengths of 6–12 m per piece and other lengths available on request. Its product information includes several grade and standards references, but the exact section, grade, dimensional standard and availability should be confirmed for each inquiry. Reported dimensional ranges should not be interpreted as a guarantee that every combination is a standard rolled size.
When sending a request, include the section designation, quantity, piece lengths, required grade, applicable standards and any processing needs such as cutting, punching or welding. If an alternate is acceptable for review, provide the design criteria and identify who will approve it. Clear inputs give the supplier a better basis for returning a comparable offer.
Common chart-reading errors to avoid
Mixing nominal and actual dimensions. A designation can contain a nominal size, while the table lists the dimensions used for that specific section. Use the latter for dimensional checks, subject to the applicable tolerances.
Assuming a listed mass is a guaranteed measured mass. Chart values are generally theoretical or nominal. Actual dimensions and mass can vary within the limits of the relevant product standard and purchase agreement.
Comparing force and mass without conversion. A dead load in kN/m is not the same unit as a mass in kg/m. Apply the appropriate gravitational conversion and the project’s design conventions when moving between them.
Leaving the standard off the drawing or purchase order. A depth and a grade alone may not uniquely define a beam. The section series, dimensional standard, material specification and required lengths make the request much less ambiguous.
Used with those checks, a beam weight chart becomes more than a quick lookup. It provides a traceable basis for quantity estimates and helps evaluators spot inconsistencies early—before a nominal size on a spreadsheet turns into the wrong section on site.
Please give us a message


Please enter what you want to find