How to Read an H-Beam Weight Chart for Load Planning and Transport
The most common mistake with an H-beam weight chart is to treat it like a simple price reference. In practice, it is a planning tool. The chart tells you how much steel you are moving, lifting, storing, and installing long before the beam reaches site. For project teams, that affects truck loading, crane selection, floor loading during staging, shipping cost, and sometimes even whether a chosen section is practical to source in the first place.
An H-beam weight chart usually lists the beam designation, section dimensions, and theoretical mass per meter or per foot. Some versions also include section area, web thickness, flange thickness, and standard length references. The key point is that the weight shown is generally theoretical unit weight based on the section geometry and steel density, not the exact measured weight of every single piece delivered. That distinction matters when you are estimating transport loads or preparing lifting calculations.
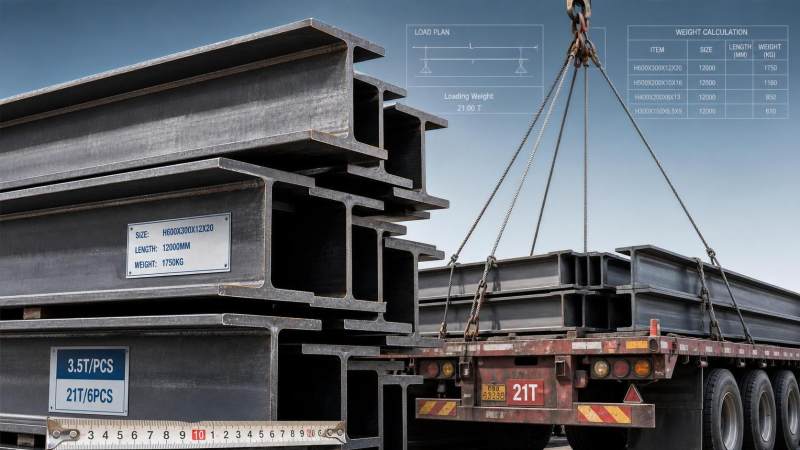
When a chart shows a beam weight such as 50 kg/m, it means one meter of that section is expected to weigh 50 kilograms under the standard dimensional assumptions behind that designation. If your order is for 12-meter lengths, each piece is roughly 600 kg before you add banding, packing, or any fabrication operations such as drilling, welding, end plates, or stiffeners. For international procurement, teams often miss this step and calculate only by section name, not by actual ordered length.
What the Chart Is Really Telling You
A beam designation describes shape and size, but the weight chart converts that geometry into something operational. In structural design, engineers care about section properties such as moment of inertia and section modulus. In logistics, those are secondary. The immediate question becomes: how many tonnes are going onto one truck, one container, one trailer, or one crane pick?
This is where the chart becomes useful beyond engineering drawings. If a procurement document lists multiple beam sizes, the weight chart helps you total the steel package quickly and check whether the planned transport method still works. A section that is structurally efficient may be awkward for transport if it creates poor bundle geometry, exceeds axle constraints after batching, or pushes a lifting plan beyond the site equipment limit.
That is also why experienced buyers cross-check the chart against the applicable standard. H-beams supplied under ASTM, EN, JIS, or GB systems can differ in designation format and dimensional series. Two beams that sound similar in conversation are not automatically interchangeable. The weight chart only makes sense if it matches the exact standard and section series being quoted.
How to Read the Main Columns Without Misjudging the Load
Most charts can be read through four practical questions:
If you only read the mass-per-meter column, you will get part of the answer. If you read the section dimensions and the intended beam length together, you get something much closer to real handling conditions.
Why Weight Charts Matter in Transport Planning
Freight cost is rarely based on steel grade alone. It is shaped by total tonnage, bundle arrangement, loading efficiency, route restrictions, and destination handling conditions. An H-beam that fits the structural calculation may still create avoidable logistics cost if its section mix leaves unused trailer space or requires partial loads.
For containerized export, weight is only one part of the equation. Long beams may face container length limits even when the total mass is acceptable. For break bulk or flat rack shipping, individual piece weight, lifting points, and port handling can become more relevant than simple tonnage. This is where early use of the chart saves time: procurement and logistics can identify whether a design package is transport-friendly before material is booked.
On site, the same chart supports temporary storage decisions. Project teams sometimes focus on delivery weight but forget the slab or yard loading during staging. A concentrated stack of beams can create a different condition from distributed installed load. The chart does not replace a handling plan, but it gives the base data required to prepare one intelligently.
Common Misreadings That Create Procurement Trouble
One frequent misunderstanding is assuming all H-beams with similar nominal depth have similar mass. They do not. Changes in flange thickness, web thickness, and series standard can produce meaningful weight differences. If a quotation, drawing, and weight chart are not aligned to the same specification source, the resulting cost estimate can drift quickly.
Another issue is confusing H-beams with I-beams as if the terms were interchangeable in every market. In informal trade language, people sometimes blur the distinction. In actual sourcing and design coordination, the geometry and designation system need to be exact. The weight chart helps expose this because unit mass and flange proportions will not line up if the wrong family is being referenced.
Teams also underestimate the effect of secondary processing. A plain rolled beam and a fabricated beam assembly are not the same transport item. Once copes, connection plates, stiffeners, or weldments are added, the final handling weight can move beyond the theoretical rolled-section value. The original chart remains useful, but it should be treated as a baseline rather than the full logistics answer.
A Practical Reading Sequence for Project Teams
A reliable approach is to read the chart in the same order the project will experience the material:
Start with the specified section and confirm the governing standard. Then confirm the unit weight. Multiply by the actual ordered length to estimate piece weight. Multiply again by the ordered quantity to estimate total tonnage. After that, check whether any fabrication or accessory steel changes the handling weight. Only then is it worth locking in transport assumptions or crane picks.
This sounds basic, but it prevents a lot of avoidable friction between engineering, purchasing, and shipping. In export supply, a manufacturer with broad standard coverage can help compare equivalent or near-equivalent section options when one series is difficult to source locally. Hongteng Fengda, for example, works across structural steel categories such as angle steel, channel steel, beams, cold formed profiles, and customized components under major standards including ASTM, EN, JIS, and GB. That matters because a weight chart is most useful when it is tied to real supply capability rather than treated as an abstract table.
In some building packages, buyers also source envelope materials alongside structural members to simplify procurement timing. Where corrosion resistance, appearance control, and low dead load are relevant for roofing or wall systems, products such as PPGI Steel Sheet may enter the same purchasing discussion. That does not change how an H-beam weight chart is read, but it does remind project teams that transport planning often covers mixed steel products, not beams in isolation.
What the Chart Cannot Tell You by Itself
A weight chart will not confirm structural adequacy. It will not tell you whether the beam meets local code design checks, whether the grade is correct, or whether the section is available with the required mill documentation. It also will not account for special coating systems, fabrication tolerances, or project-specific packing methods.
That limitation is useful to remember because many coordination problems come from asking the chart to answer questions outside its scope. It is a powerful reference, but only for the things it actually describes: geometry-derived mass and, sometimes, dimensional context.
The same principle applies when comparing material packages. A lighter section is not automatically the better purchasing choice if it increases fabrication complexity, lead time risk, or section substitution issues. Likewise, a heavier section is not automatically inefficient if it improves availability and simplifies transport grouping. The chart gives a numerical starting point; the final decision still belongs to the project context.
Reading the Chart with Better Questions
The most useful question is not “What does this beam weigh?” but “What does this weight mean for our next decision?” If the next decision is freight budgeting, total tonnage matters. If it is crane planning, piece weight and length matter more. If it is temporary storage, bearing area and stacking arrangement enter the picture. If it is procurement comparison, standard alignment becomes the first check.
That is why a good H-beam weight chart is less about memorizing numbers and more about reading context correctly. Once project teams use it that way, they make fewer specification errors, ask better supplier questions, and avoid the common gap between drawing intent and transport reality.
Please give us a message


Please enter what you want to find